http://www.epfr.com/Case_Studies/IFR_brochure.pdf
Terms
Definition of 'Fund Flow'
The net of all cash inflows and outflows in and out of various financial assets. Fund flow is usually measured on a monthly or quarterly basis. The performance of an asset or fund is not taken into account, only share redemptions (outflows) and share purchases (inflows).
Definition of 'Hedge Fund'
An aggressively managed portfolio of investments that uses advanced investment strategies such as leveraged, long, short and derivative positions in both domestic and international markets with the goal of generating high returns
Definition of 'Quant Fund'
An investment fund that selects securities based on quantitative analysis. In a quant fund, the managers build computer-based models to determine whether an investment is attractive. In a pure "quant shop" the final decision to buy or sell is made by the model; however, there is a middle ground where the fund manager will use human judgment in addition to a quantitative model.
Definition of 'Bull Market'
A financial market of a group of securities in which prices are rising or are expected to rise. The term "bull market" is most often used to refer to the stock market, but can be applied to anything that is traded, such as bonds, currencies and commodities.
Definition of 'Bear Market'
A market condition in which the prices of securities are falling, and widespread pessimism causes the negative sentiment to be self-sustaining. As investors anticipate losses in a bear market and selling continues, pessimism only grows.
Inflation Adjustment
If a series of data is measured in terms of Nominal Values (Money 'Dollar','Yen') an inflation adjustment is required to show the "True Growth". This adjustment is said to be in Constant dollars. therefore it may stabilize variance of random data or fluctuation.if the series is measured in number of widgets produced or hamburgers served or percent interest, it makes no sense to deflate
Logarithmic Adjustment
Auto-Regressive Integrated Moving Average
ARIMA models are, in theory, the most general class of models for forecasting a time series which can be stationarized by transformations such as differencing and logging. In fact, the easiest way to think of ARIMA models is as fine-tuned versions of random-walk and random-trend models: the fine-tuning consists of adding lags of the differenced series and/or lags of the forecast errors to the prediction equation, as needed to remove any last traces of autocorrelation from the forecast errors.
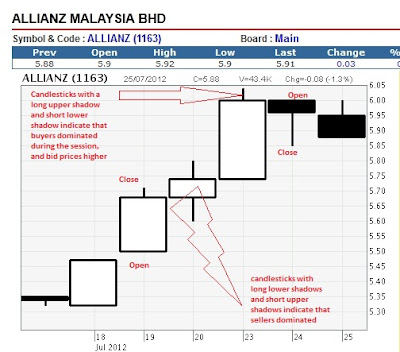
Reading the candlestick charts-
data set that contains open, high, low and close values
Long white candlesticks show strong buying pressure.
Long black candlesticks show strong selling pressure.
Candlesticks with short shadows indicate that most of the trading action
was confined near the open and close. Candlesticks with long shadows
show that prices extended well past the open and close.


No comments:
Post a Comment